library("tidyverse")
library("ggpubr")
library("broom")Linear Regression
Load libraries
Simple regression
iris %>%
  ggplot(aes(x=Sepal.Length, y=Sepal.Width)) +
  geom_point() +
  stat_smooth(method="lm") +
  stat_regline_equation() +
  theme_bw()
`geom_smooth()` using formula = 'y ~ x'
iris %>%
  ggplot(aes(x=Sepal.Length, y=Sepal.Width)) +
  geom_point(aes(color=Species)) +
  stat_smooth(method="lm", se = FALSE) +
  stat_regline_equation() +
  theme_bw()
`geom_smooth()` using formula = 'y ~ x'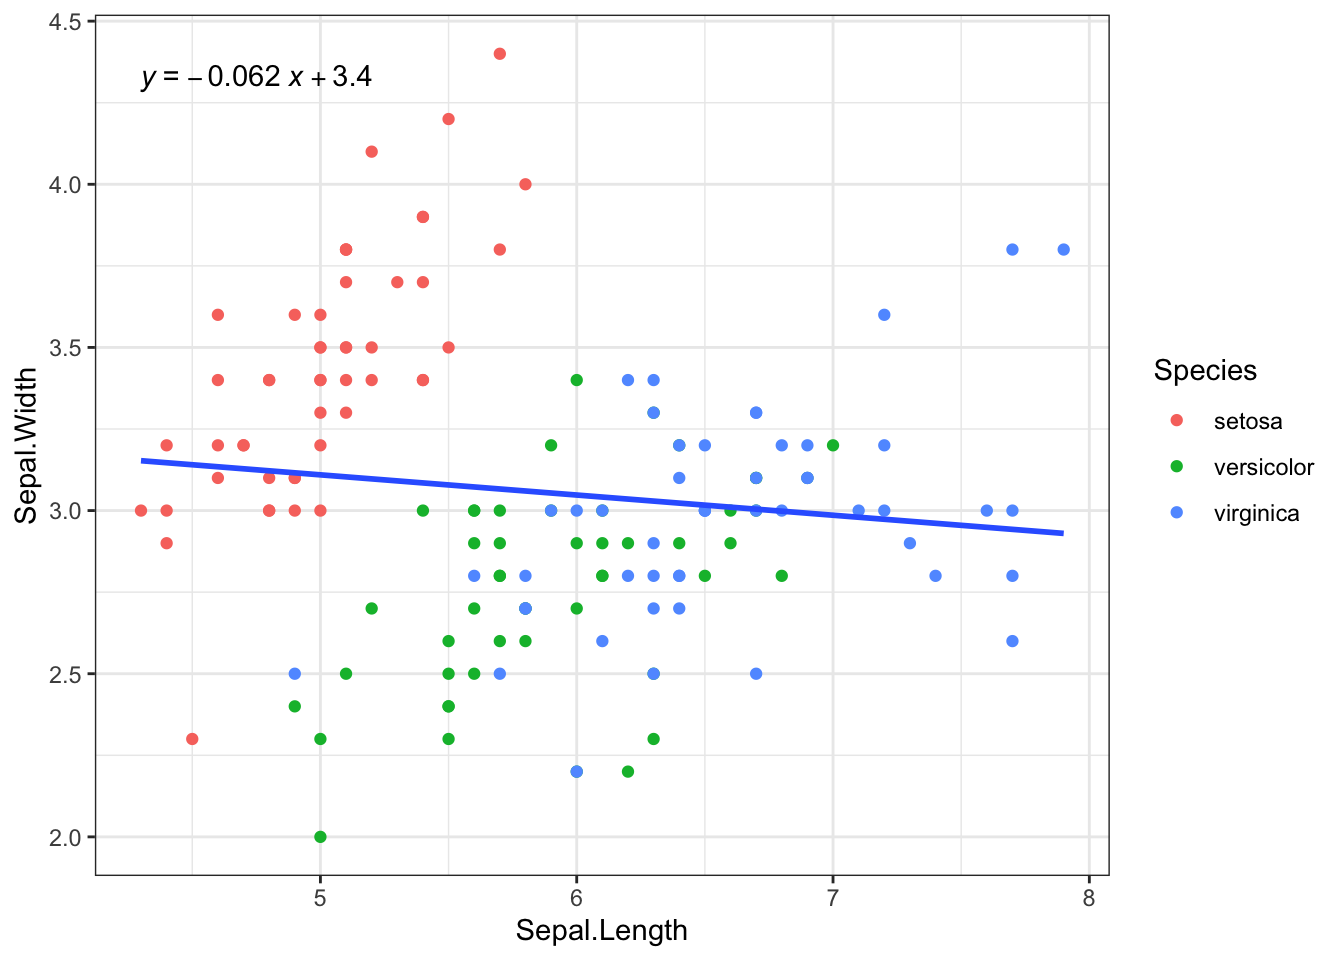
iris %>%
  ggplot(aes(x=Sepal.Length, y=Sepal.Width, color=Species)) +
  geom_point() +
  stat_smooth(method="lm", se = FALSE) +
  stat_regline_equation() +
  theme_bw()
`geom_smooth()` using formula = 'y ~ x'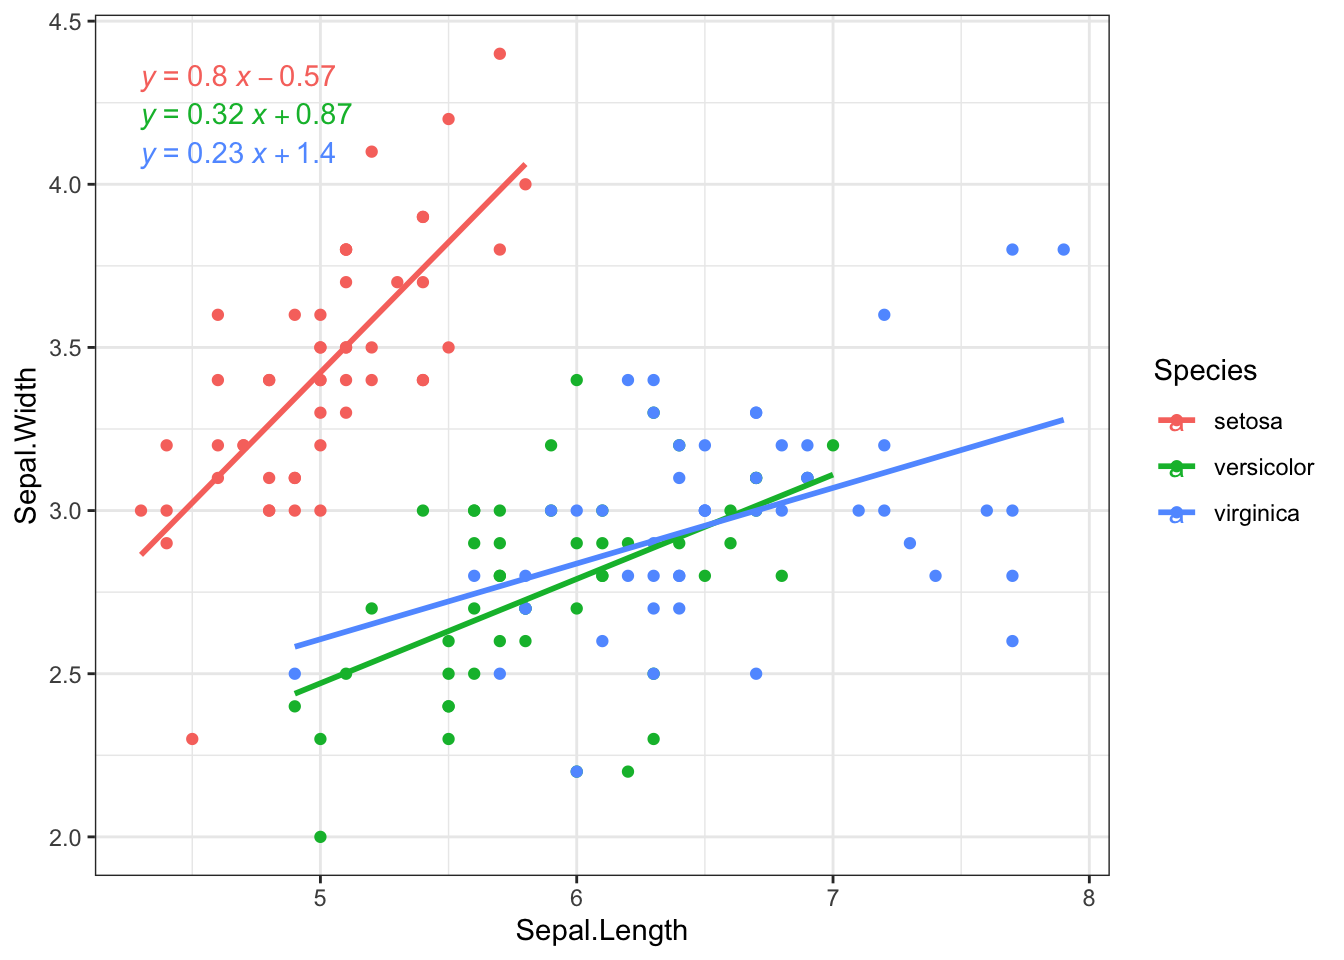
iris %>%
  lm(Sepal.Width ~ Sepal.Length, data = . ) %>%
  tidy()
# A tibble: 2 × 5
term estimate std.error statistic p.value
<chr> <dbl> <dbl> <dbl> <dbl>
1 (Intercept) 3.42 0.254 13.5 1.55e-27
2 Sepal.Length -0.0619 0.0430 -1.44 1.52e- 1Multivariate regression
without interaction (with fixed slope)
model_multy <-lm( Sepal.Width ~ Sepal.Length + Species, data = iris)

model_multy %>% tidy()
# A tibble: 4 × 5
term estimate std.error statistic p.value
<chr> <dbl> <dbl> <dbl> <dbl>
1 (Intercept) 1.68 0.235 7.12 4.46e-11
2 Sepal.Length 0.350 0.0463 7.56 4.19e-12
3 Speciesversicolor -0.983 0.0721 -13.6 7.62e-28
4 Speciesvirginica -1.01 0.0933 -10.8 2.41e-20# predict(model_multy, iris)# Get the model predictions
iris$predicted_multy <- predict(model_multy, iris)ggplot(iris, aes(x = Sepal.Length, y = Sepal.Width, color = Species)) +
geom_point() +
geom_line(aes(y = predicted_multy), linewidth = 1) +
labs(title = "Sepal Width vs Sepal Length by Species",
x = "Sepal Length",
y = "Sepal Width") +
theme_minimal()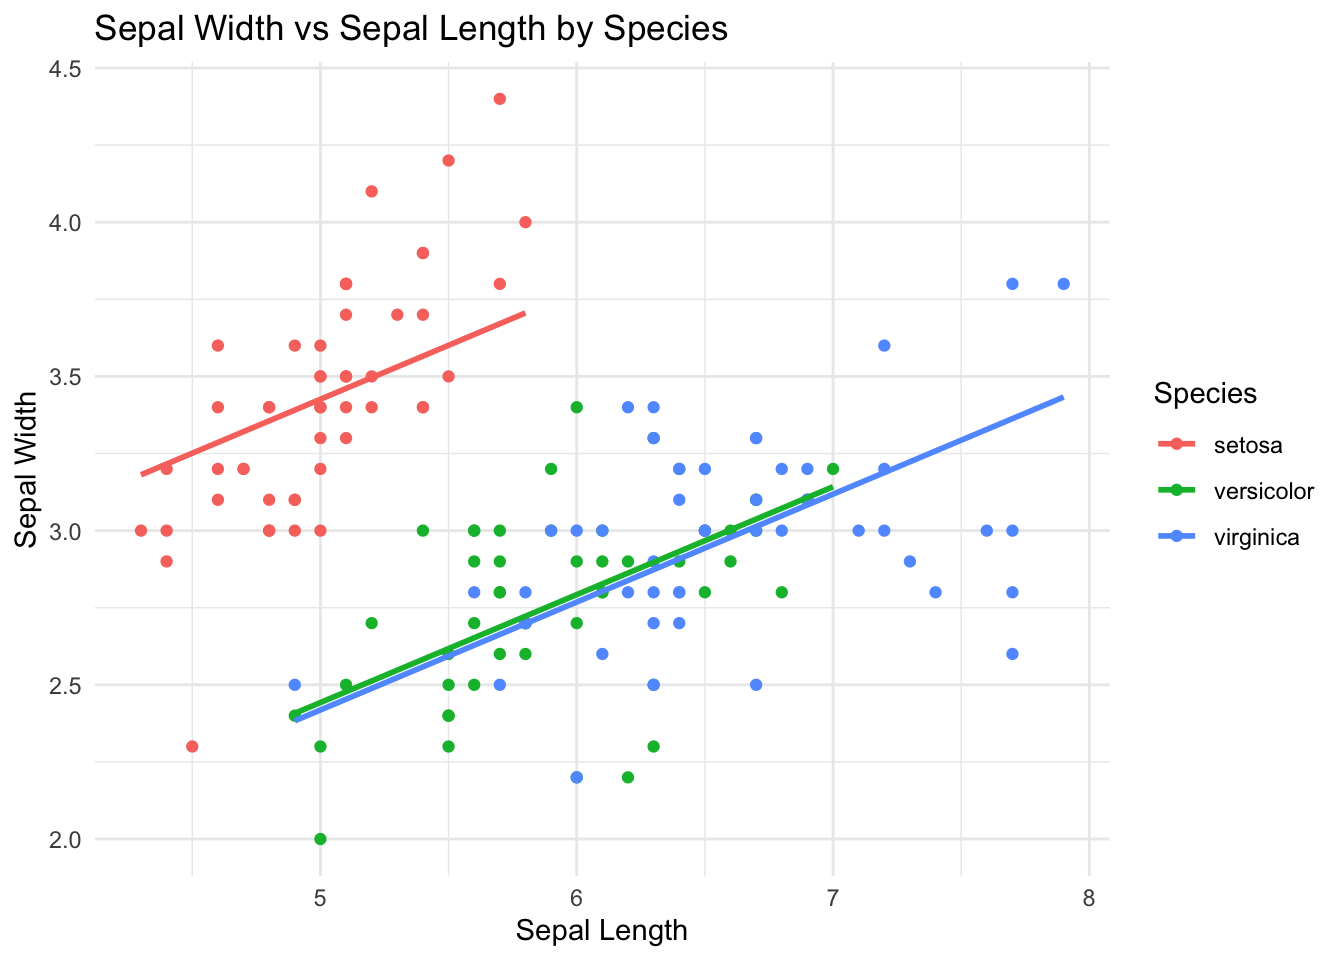
# iris %>%
#   ggplot(aes(Sepal.Length, predicted_multy))+
#   geom_point(aes(colour = Species))
With intereaction (different slopes)
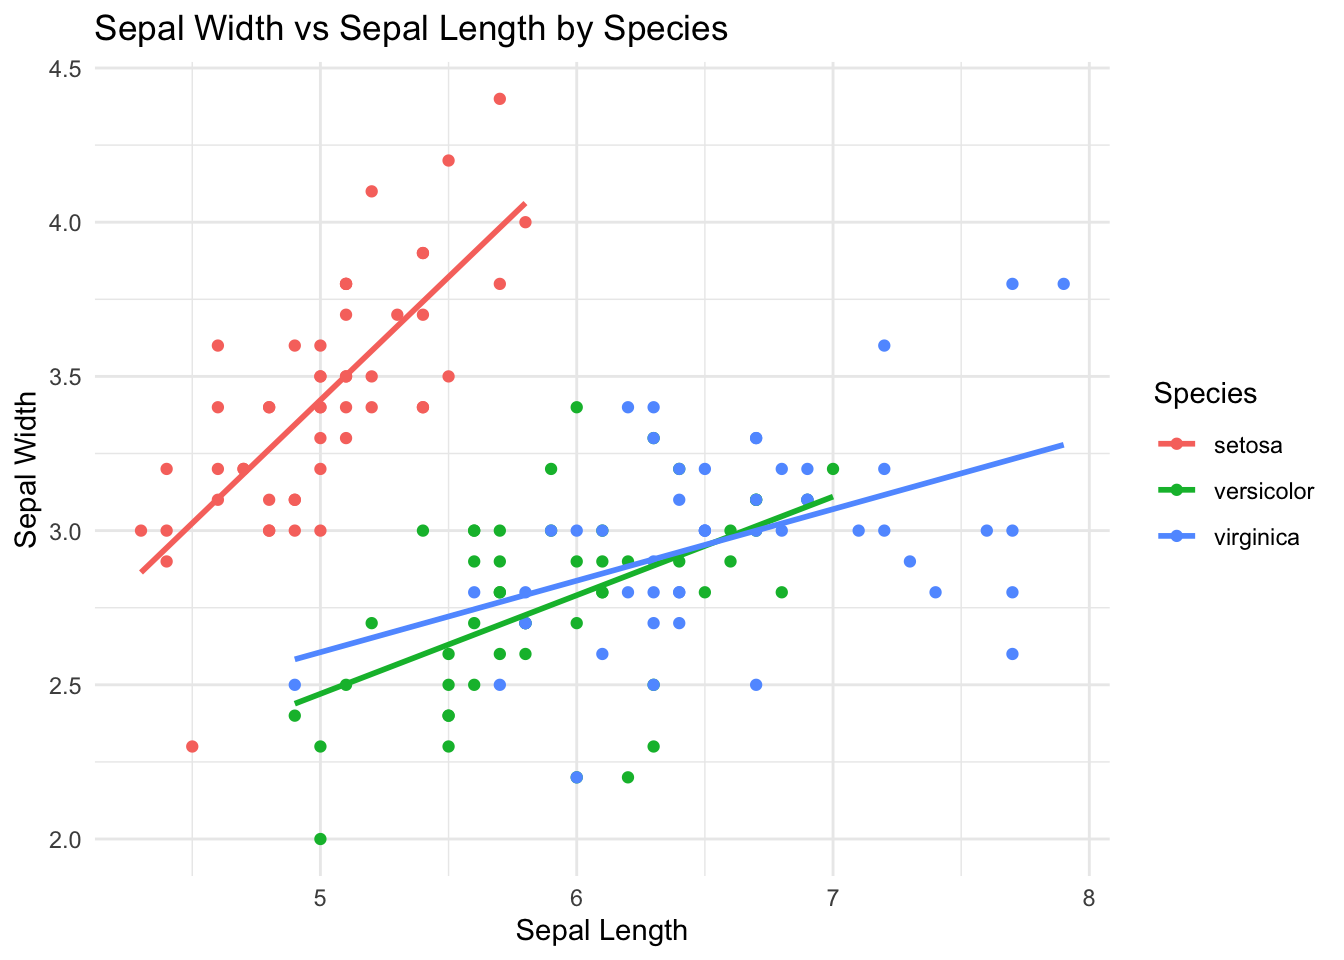
model_int <- lm(Sepal.Width ~ Sepal.Length * Species, data = iris)

model_int %>% tidy()
# A tibble: 6 × 5
term estimate std.error statistic p.value
<chr> <dbl> <dbl> <dbl> <dbl>
1 (Intercept) -0.569 0.554 -1.03 3.06e- 1
2 Sepal.Length 0.799 0.110 7.23 2.55e-11
3 Speciesversicolor 1.44 0.713 2.02 4.51e- 2
4 Speciesvirginica 2.02 0.686 2.94 3.85e- 3
5 Sepal.Length:Speciesversicolor -0.479 0.134 -3.58 4.65e- 4
6 Sepal.Length:Speciesvirginica -0.567 0.126 -4.49 1.45e- 5# Get the model predictions
iris$predicted <- predict(model_int, iris)
ggplot(iris, aes(x = Sepal.Length, y = Sepal.Width, color = Species)) +
geom_point() +
geom_line(aes(y = predicted), size = 1) +
#geom_smooth(method="lm", se = FALSE) +
labs(title = "Sepal Width vs Sepal Length by Species",
x = "Sepal Length",
y = "Sepal Width") +
theme_minimal()Warning: Using `size` aesthetic for lines was deprecated in ggplot2 3.4.0.
ℹ Please use `linewidth` instead.